Activity
Mon
Wed
Fri
Sun
Jan
Feb
Mar
Apr
May
Jun
Jul
Aug
Sep
Oct
Nov
What is this?
Less
More
Memberships
Day Trading Network
22 members • Free
11 contributions to Day Trading Network

2 likes • 14d
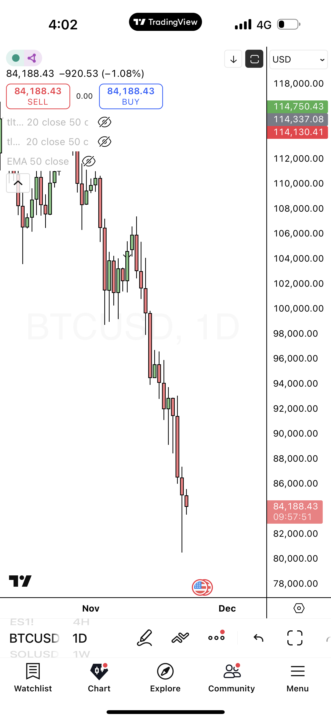
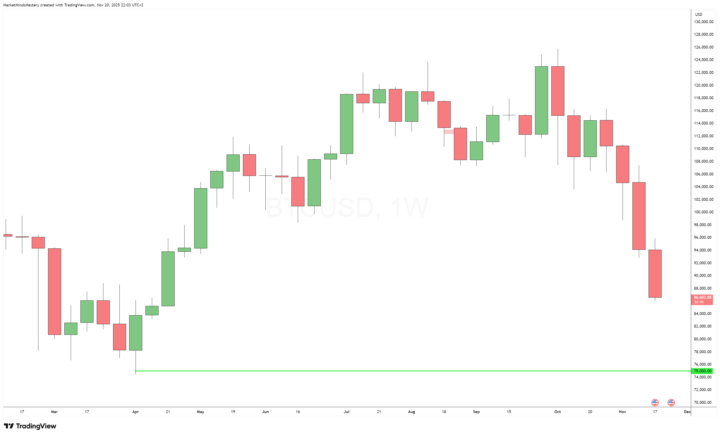
I think Bitcoin looks worse than I anticipated when the downside move began. Monthly (logarithmic scale): - divergence between Stochastic RSI and price; - MACD – bearish crossover coinciding with a price break below the lower boundary of the channel. Weekly: - previous noticeable retracements were >80%, lasting at least about 1 year; - if the October high is confirmed, an 80% decline could imply a drawdown to 25,240.I don’t know what fundamentals could justify such a dim outlook for BTC — I’m just looking at the charts from a technical perspective.The correction might not be that deep, though, and price could simply move sideways. Daily: - if a few days of bullish price action occur, I would expect more weakness to follow rather than the resumption of the uptrend.
1 like • 16d
A rising ending diagonal (or rising wedge) usually implies sharp and fast reversals, retracing at least back to where it began snd even lower. They are found at the termination points of larger patterns, indicating exhaustion of the larger movement.
1 like • 19d
A yummy sandwich! Not the moment to give up bread :)
21d •
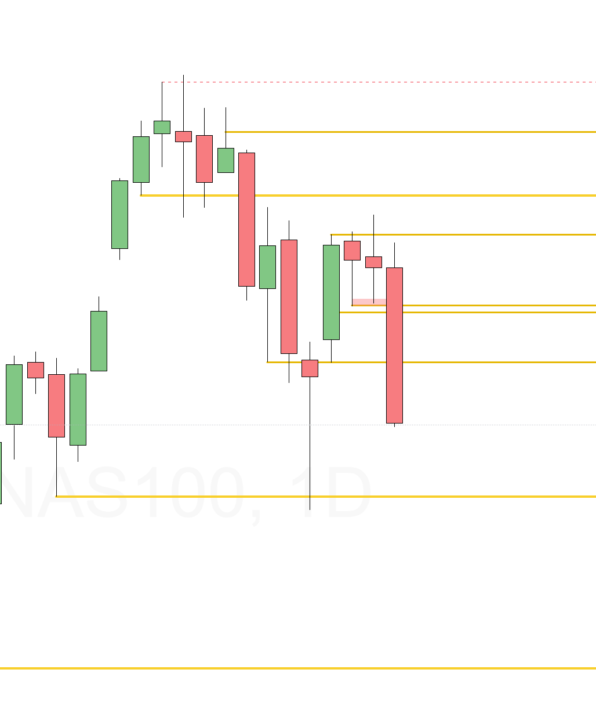
My thoughts on Nasdaq
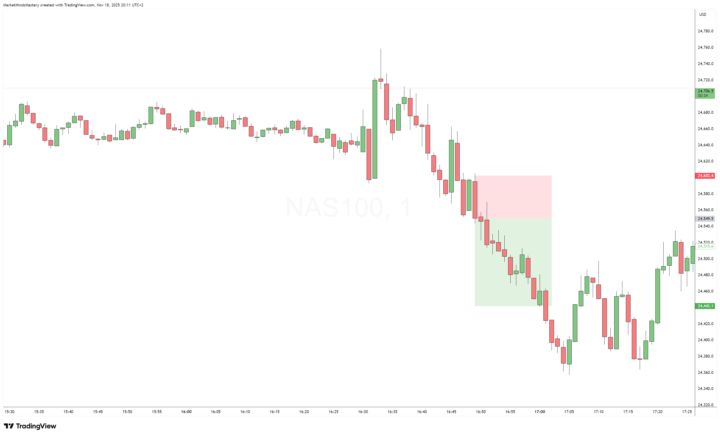
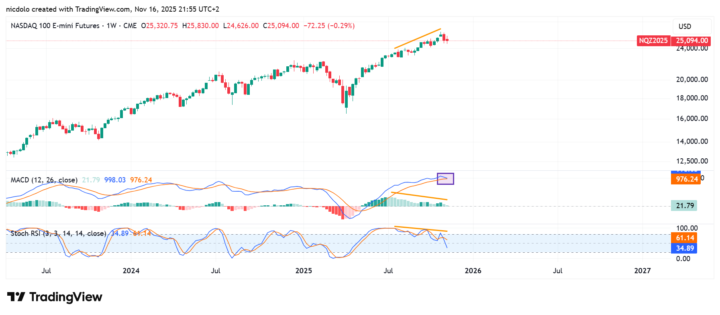
Weekly: - bullish price action; - warnings: - bearish engulfing (strong candlestick) formed at a cluster of 1.618 Reverse Fibonacci levels; - oscillators: Stochastic RSI - in a bearish mode; - displays divergence. The oscillators behaviour is not a signal to take action, but a sign the market is weak. Daily: - doji at the middle corrective channel; - daily closed above EMA50 - Monday has the potential for a bullish day. H1: - the decline from Nov12 can be counted as a 5-wave move; an A-B-C correction should be made to correct that 5-wave move. - price at the moment seems to be in wave B of the correction, so a wave C to the upside is expected. - once wave C completed, I'm expecting either a deeper or sideways price movement. When looking at D charts, I noticed the decline starting October 30 is the first one overlapping a previous daily high. The weekly close still holds, so price may struggle to break it. A daily close above November 12 high invalidates the continuation of the bear trend. Elliott waves are used for context, not as a stand-alone strategy.
1 like • 20d
Thank you, Theo!
2 likes • 20d
Thanks, Eva! Waiting for the London open?

24d •
NASDAQ Chart Is Scary!
Nasdaq is down 2.32% and its keep declining(left chart) . Biggest reason is TESLA (right chart). U.S. stocks sink as post-shutdown optimism fades, rate cut odds fall below 50% Do you think they will find buyers soon to life the price higher?
Poll
3 members have voted
1 like • 23d
Sorry for the late response — I’ve just seen the post. The Nasdaq appears to have completed a 5-wave advance. Even if this isn’t the start of a major downtrend, a correction larger in both time and price than any previous one should be expected. At the moment, further bearish action is anticipated, supported by the daily price action. Critical level: 25,700Potential target: 24,000 On the lower timeframe (H1), it seems too late to join the trend, as a 5-wave structure looks complete. Perhaps after a retracement. Just my thoughts.
1-10 of 11