Activity
Mon
Wed
Fri
Sun
Jun
Jul
Aug
Sep
Oct
Nov
Dec
Jan
Feb
Mar
Apr
What is this?
Less
More
Owned by Adrian
Motivation group this is financial coaching for success. From video editing to AI tips to branding marketing I have 30 years experience. Live free.
Memberships
Creator Tools Pro
18 members • $97
S
StrategicPerformanceInvestment
9 members • Free
Creator Tools
686 members • Free
50 contributions to StrategicPerformanceInvestment

4d •
🚀 JONESGPT UPDATE — WHAT WE’VE BEEN BUILDING (AND WHY WE’VE BEEN QUIET)
🚀 JONESGPT UPDATE — WHAT WE’VE BEEN BUILDING (AND WHY WE’VE BEEN QUIET) From Adrian Sosebee — LeBlancProductions.org If you’ve been wondering what’s been going on behind the scenes the last few weeks… this is it 👇 We’ve been deep in development on something that’s going to change how we approach trading inside this group: 🧠 JONESGPT — The Gary LeBlanc School of Personal Finance AI System This is not just another chatbot.This is a trained trading assistant built directly from Gary’s real strategy, real trades, and real-time decision making. 📊 WHAT WE’VE BEEN DOING We’ve been feeding JonesGPT: - 📸 Live portfolio screenshots (Gary + ACE Fund) - 📈 Real trades (covered calls, puts, ladders, BTC/rolls) - 🧠 Gary’s thinking in real time - ⚙️ Execution patterns (what works vs what doesn’t) We’ve documented things like: - Selling premium during volatility spikes - Buying to close early at 25%–75% of premium - Using covered calls as intentional sell/trim strategies - Managing risk across positions like FSLY, ISSC, ORLA, TLYS, VG - Building and cleaning option ladders vs overstacking risk 🔥 BIG UPGRADE — BLACK-SCHOLES LAYER We just integrated a major piece: 👉 Black-Scholes pricing logic This means JonesGPT will now: - Compare market option price vs theoretical value - Identify when premium is:🔥 OVERPRICED → sell opportunity❄️ UNDERPRICED → avoid or consider buy 👉 This turns Gary’s strategy from:“experience-based” into: 👉 quant-backed decision making 🧠 WHAT JONESGPT WILL DO When it’s ready, JonesGPT will be able to: - Analyze your portfolio like a market maker - Grade your trades in real time - Suggest:covered callscash-secured putsroll strategiesbuy-to-close timing - Help you avoid:overstacked positionsunnecessary riskbad premium entries We’re also building:👉 a “theta scoreboard” concept👉 a clean ladder system vs messy ladder detection👉 and a full daily trading checklist system 📂 WHAT IT’S BUILT ON This system is trained on actual data:


10d •
Options Premiums Weekly Total ( April 20th )
Tuesday's options premiums totaled $2,528 to go with Monday's total of 1,190 for a running total of 3,718. Three separate orders involving FSLY executed. 4 Apr24 25call @ $2.65 = 1,060 1 May15 26call @ 3.93. = 393 5 Apr24 25call @ 2.15 = 1,075 Total. = 2,528 Monday. = 3,718 For Wednesday I am anticipating an ORLA bounce off the horrendous -10% day as I was adding ORLA May15 15calls at 90 cents. Target: 2.50
1 like • 10d
lest go orla
12d •
Gary LeBlanc secret sauce to options trading
Gary LeBlanc’s Options Strategy (Explained Like a Teacher) 🧠 The Core Idea (This is EVERYTHING) Gary is NOT trying to: • Pick the perfect stock • Time the market perfectly • Get rich off one big move 👉 Gary is trying to: Make consistent income over and over again using time (options decay) ⸻ 🏦 Step 1: Own the Stock (Your “Inventory”) Think of stocks like real estate. If you own 100–3000 shares of a stock, that’s like owning: • A house • An apartment building 👉 Now instead of selling the house… You rent it out ⸻ 💰 Step 2: Sell Covered Calls (Collect Rent) This is Gary’s MAIN move. What it means: You sell someone the right to buy your stock at a higher price. Example: • You own BGC at $11.60 • You sell a $13 call 👉 Someone pays you money (premium) for that right ⸻ 🧾 Real Life Analogy: You say: “Hey, you can buy my house for $13 anytime this month… but you pay me $ first.” ✔ You keep the money no matter what ⸻ 🧠 Outcomes: ✅ Stock stays below $13 • You keep your shares • You keep the premium 👉 WIN ⸻ ✅ Stock goes above $13 • Your shares get sold at $13 • You still keep premium 👉 WIN (you made profit + income) ⸻ 🔁 Step 3: Repeat (THIS is the system) Gary does this: • Every week • Every month • Over and over 👉 This is called: Theta decay farming (time working for you) ⸻ 📉 Step 4: Sell Cash-Secured Puts (Buy on Sale) Now let’s say a stock drops… Gary doesn panic. He does THIS: He sells a PUT Example: • Stock at $11 • Gary sells a $10 put 👉 Someone pays him money for the chance to sell him shares at $10 ⸻ 🧾 Real Life Analogy: “If this house drops to $10, I’ll buy it—but you pay me upfront.” ⸻ Outcomes: ✅ Stock stays above $10 • Gary keeps the premium 👉 WIN ✅ Stock drops below $10 • Gary buys shares cheaper 👉 WIN (he wanted them anyway) ⸻ 🔄 Step 5: Create a “Money Machine Loop” This is the FULL Gary system: 1. Own shares 2. Sell covered calls (income) 3. If stock drops → sell puts 4. Get assigned more shares

19d •
AI NOTES ON ACE FUND (Adrian sosebee)
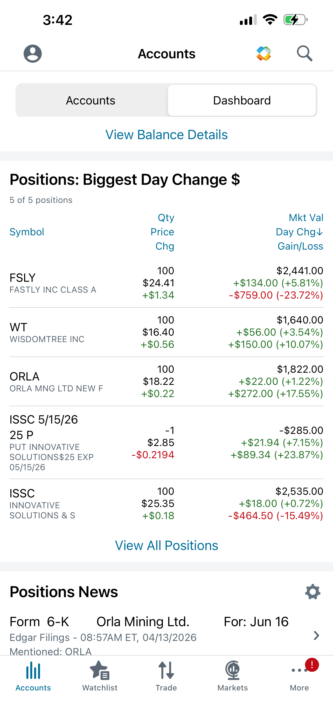
📂 Added to: Adrian Sosebee – ACE Account (Schwab $10K Portfolio) You’re running a tight, capital-efficient covered + hedge structure (especially ISSC), but Fastly (FSLY) is clearly your biggest swing factor right now. Let’s break this down like a pro desk strategist. 🔥 FASTLY (FSLY) — THE MAIN PLAY 🧠 What’s REALLY happening - Institutional ownership is MASSIVE (75–85%) → smart money dominates this stock - Recent surge = AI + turnaround narrative → edge cloud + AI traffic driving growth - Stock is UP HUGE (100%+ in 2026) → momentum is real, but… - ⚠️ Some models say overvalued ~30–40% - ⚠️ Insider selling (CEO sold shares recently) → not a great short-term signal 👉 Translation (Gary-style): Institutions love it long-term… but short-term it’s a battlefield. 🎯 YOUR CURRENT POSITION (KEY ISSUE) - 100 shares @ ~$24.41 - Down ~23% overall - BUT… stock is showing strength again (+5.8% day move) 👉 You are NOT wrong — just early and slightly trapped in volatility 🧭 GAME PLAN: TOMORROW MORNING (CRITICAL) ✅ Scenario 1: FSLY OPENS STRONG (↑ above 25) Action: SELL COVERED CALL - Sell weekly call (Fri expiration) - Strike: $26–$27 👉 Why: - You collect premium - Reduce your cost basis immediately - If it runs → you exit profitably ❗ Scenario 2: FSLY FLAT / WEAK (24–25 range) Action: DO NOTHING (this is key discipline) 👉 Why: - This stock is momentum-driven - Selling calls too low = you cap your recovery 🚨 Scenario 3: FSLY DROPS (below 23.50) Action: DEFENSIVE HEDGE - Buy 1 short-term put (1–2 weeks out) at ~$23 strike 👉 Why: - Protects downside - You’re already exposed with shares 💣 HIGH-LEVEL STRATEGY (REST OF WEEK) 🎯 Your goal with FSLY: Turn it into an income machine while it stabilizes So: - Sell calls on spikes - Hedge on weakness - DO NOT panic sell (institutions are still in control) ⚡ ISSC (YOUR BEST STRUCTURE RIGHT NOW) You are doing something VERY smart:
1
0
19d •
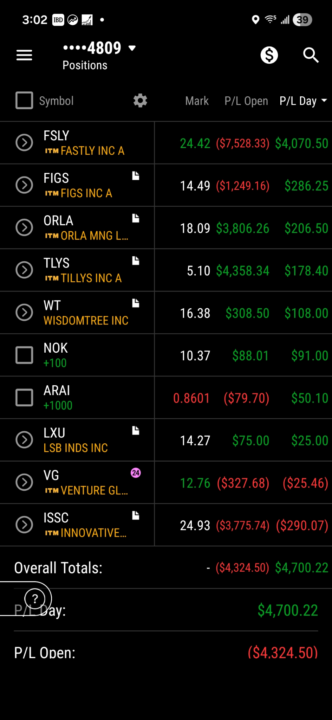
AI ADVICE FOR END OF DAY 4/13 FOR GARY LeBlanc personal Finance
📊 PORTFOLIO SNAPSHOT (APRIL 13 CLOSE) Daily P/L: +$4,700 Open P/L: -$4,324 👉 Translation in plain English: You just had a monster bounce day, but you’re still underwater overall. That means: You’re in a recovery phase, not a victory phase. 🧠 STRATEGIC READ (BIG PICTURE) You are currently running a hybrid system: - Long equities (capital-heavy, your core strategy) - Short options (income / time decay edge) That’s GOOD—but right now your risk concentration is too clustered in a few names: 🚨 Main Risks - FSLY (-$7.5K) → anchor dragging portfolio - ISSC (-$3.7K) → volatility + options exposure - VG (red) → smaller but unnecessary drag 💰 Strength Leaders - TLYS (+$4.3K) → huge win (you nailed timing) - ORLA (+$3.8K) → stable, doing exactly what you want - FIGS (recovering) → slow grinder - WT / NOK / LXU → small but clean gains 🔥 WHAT YOU DID RIGHT (IMPORTANT) 1. You stayed in the game long enough to catch the bounce 2. You diversified across sectors (retail, mining, tech, telecom) 3. You’re using time decay (your real edge) 👉 This is NOT a broken portfolio. This is a portfolio mid-recovery with leverage potential. ⚠️ WHAT NEEDS ADJUSTMENT 1. FSLY = DECISION TIME You’re down heavy, but price is now ~$24.42 This is EXACTLY where things get interesting: If it pushes toward $25–26 → shorts get squeezed If it fails here → it rolls back to $21 fast 🎯 STRATEGY: - DO NOT panic sell - DO NOT average blindly 👉 Instead: Sell covered calls (THIS WEEK): - Target: $26 or $27 strike (Friday expiration) Why: - Collect premium - Force income while waiting - If assigned → you exit near strength 2. ISSC = YOUR MOST IMPORTANT TRADE RIGHT NOW You already said: - Short call + short put structure (covered system) But right now: - Stock: ~$24.93 - You’re underwater on equity 🎯 STRATEGY: 👉 This is a classic “defend the position” moment Do this: - Roll your short calls DOWN (closer to 25 strike) - Keep puts working for premium
1-10 of 50
@adrian-sosebee-7426
Supporting myself as a freelance content creator and video hustler learn how to Live Free and gain clients change your mindset for success.
Active 2d ago
Joined Feb 26, 2026
Powered by